Some science linkage:
Satellite images of California in Jan 2013 vs. Jan 2014 show the extent of the current drought. (Yale e360)
Every Earth view from Gravity identified in Google Earth. You'll be shocked to find that the orbit doesn't make any sense. (Ogle Earth)
A recent Type Ia supernova in nearby galaxy M82. This one won't quite be bright enough to see with your naked eye (8th magnitude at peak), but still very close-by -- a mere 12 million ly away! (Bad Astronomy)
A skeptical look at D-wave, allegedly the first commercial quantum computer. Doesn't go into very much physics detail about the current challenges, but still interesting. (Inc.)
The Social Life of Genes. (Pacific Standard)
Annnd, here's a cool graphic of the ranking of U.S. cities by population over time. Caveat emptor when it comes to using rank data, but it's a cool looking graph. (peakbagger)
Showing posts with label data. Show all posts
Friday, January 24, 2014
Saturday, November 03, 2012
Your Election in Charts
Here's a bit of pre-election Obama propaganda in chart form, making the case that his domestic agenda has mostly been pretty good, if not the magical transformation some hoped for.
For me the policy that stands out as most worth saving are the pre-existing conditions ban and the coverage of 30 million uninsured under Obamacare. Mostly I want Obama to win so that those policies will come into effect in 2014 and won't be repealed as Romney has promised. More than the specifics of the law, the survival of Obamacare would signal the ability of government to actually make progress on the really hard problems facing the country (like health care), instead of just talking them over for decades on end. If Obamacare survives then it can be tweaked and improved, if it's repealed then all the political effort will have been wasted and we'll be back with the crappy status quo. The political repercussions of an Obamacare repeal would be enormous, to say nothing of the human toll.
In addition, whoever is elected will most likely get credit for the economic recovery. It would be crushingly unfair to see a President Romney take credit for Obama's tough, unpopular decisions.
After four years I am still mostly positive toward Obama. He hasn't been perfect. Some of his failures are his fault (such as the drone/terrorism fiasco), while others are the result of a broken Senate and a remarkably skillful and unified opposition. But he's pointed in the right direction.
Tuesday, November 01, 2011
Climategate Was a Hoax
My hometown paper the other morning published an op-ed from Victor Davis Hanson crowing about how climate change was now a dead issue. Hanson is supposed to be this well-respected academic (Fresno State classics scholar, Hoover Institution, etc.) but this was amateur hour. Naturally he dredged up the canard about the earth cooling over the past ten years, which I ranted about previously. We also got complaints about how Al Gore has a big house. (Note to skeptics: no one cares about Al Gore. He's not the king of climate change.)
I wouldn't've commented on it except that Prof. Hanson also felt no qualms about continuing to slander honest scientists. Referencing Climategate, he claims that climate scientists were "manipulating scientific evidence" -- fighting words, basically, in the scientific community. But he makes no mention of the six (6!) independent investigations that cleared the scientists of any scientific misconduct. (Check out this extremely informative page from UCS which explains exactly what Climategate was all about and what the investigations found.)
Sometimes it seems like these fact-free memes will just continue to circle the globe for decades and we'll be reading the same thing in 2037. But this op-ed came out shortly after the Berkeley group's highly publicized re-analysis of the surface temperature records, one of the key pieces of evidence for global warming that had been under question thanks to the Climategate emails. For added drama the group's leader, Richard Muller, had been a pretty vocal skeptic of some parts of climate science. But clearly he let the data speak for themselves and reported a finding almost exactly identical to the previous 3 data reconstructions (NASA, NOAA, HadCRU).
It was a pretty big black eye for climate skeptics and anyone who really thinks that scientists were "manipulating" the data. Bad luck for Prof. Hanson, I guess, although I doubt he cares. The money quote from Dr. Muller: "the biggest surprise was that the new results agreed so closely with the warming values published previously by other teams in the US and the UK." And the money graph (via the BBC), comparing the new results with the older three:

The four curves are remarkably similar and they all go up. Maybe this will mark a turning point regarding the media's coverage of Climategate -- a talkingpoint of equal and opposite weight, as it were. We can only hope.
I wouldn't've commented on it except that Prof. Hanson also felt no qualms about continuing to slander honest scientists. Referencing Climategate, he claims that climate scientists were "manipulating scientific evidence" -- fighting words, basically, in the scientific community. But he makes no mention of the six (6!) independent investigations that cleared the scientists of any scientific misconduct. (Check out this extremely informative page from UCS which explains exactly what Climategate was all about and what the investigations found.)
Sometimes it seems like these fact-free memes will just continue to circle the globe for decades and we'll be reading the same thing in 2037. But this op-ed came out shortly after the Berkeley group's highly publicized re-analysis of the surface temperature records, one of the key pieces of evidence for global warming that had been under question thanks to the Climategate emails. For added drama the group's leader, Richard Muller, had been a pretty vocal skeptic of some parts of climate science. But clearly he let the data speak for themselves and reported a finding almost exactly identical to the previous 3 data reconstructions (NASA, NOAA, HadCRU).
It was a pretty big black eye for climate skeptics and anyone who really thinks that scientists were "manipulating" the data. Bad luck for Prof. Hanson, I guess, although I doubt he cares. The money quote from Dr. Muller: "the biggest surprise was that the new results agreed so closely with the warming values published previously by other teams in the US and the UK." And the money graph (via the BBC), comparing the new results with the older three:
The four curves are remarkably similar and they all go up. Maybe this will mark a turning point regarding the media's coverage of Climategate -- a talkingpoint of equal and opposite weight, as it were. We can only hope.
Sunday, February 08, 2009
Better E-Government
Rumor has it that Obama will name Vivek Kundra to be his administrator for E-Government. This position (which is different than the long-rumored federal Chief Technology Officer) lives inside OMB and is responsible for coming up with cool ways of using the internet to make the government work better.
Kundra is currently the CTO for the District of Columbia where he recently ran a really nifty contest called Apps for Democracy. The contest allowed regular citizens access to DC's information databases -- everything from real-time information about which parking meters are in use to census and building permit information. The city then gave out prizes for the most innovative web application that makes that information available to the public.
The winners can be found here. The gold-medalist is a website called www.ilive.at that allows you to enter a street address (currently DC only) and it pulls up a ton of information about the surrounding area. It's pretty nicely done and the benefits of doing this sort of thing with federal data would be, of course, enormous. (h/t Emily.)
Monday, January 19, 2009
Long Goodbye, Almost Gone
Well there's less than 24 hours left in President Bush's term. Seems like a good time for one last peek at the good ole Bush approval rating chart, doncha think?
Data compiled by Prof. Pollkatz
A long slow slide with a few punctuation marks here and there. Man, doesn't it seem like Bush has been a lame duck forever? At least since the 2006 elections (and maybe since Katrina) it seems like the country's just been waiting around for someone - anyone! - else to take over. Even Bush himself seems to have a massive case of senioritis.
At any rate: good riddance. Torture, wiretapping, lies about WMD, the Iraq war, Guantanamo, politicizing the Justice Department, the war on science, gutting the Clean Air Act, eight years of nothing on climate change, tax cuts for the rich, and the worst recession since the Great Depression. I hope he enjoys his retirement.
Data compiled by Prof. PollkatzA long slow slide with a few punctuation marks here and there. Man, doesn't it seem like Bush has been a lame duck forever? At least since the 2006 elections (and maybe since Katrina) it seems like the country's just been waiting around for someone - anyone! - else to take over. Even Bush himself seems to have a massive case of senioritis.
At any rate: good riddance. Torture, wiretapping, lies about WMD, the Iraq war, Guantanamo, politicizing the Justice Department, the war on science, gutting the Clean Air Act, eight years of nothing on climate change, tax cuts for the rich, and the worst recession since the Great Depression. I hope he enjoys his retirement.
Monday, September 29, 2008
Data Blogging: the Electoral College
Defenders of the Electoral College claim that it serves to amplify the popular vote margin of victory and therefore (theoretically) enhances the legitimacy of the elected president. I was curious what the data looked like so I plotted it up. (Data courtesy of wikipedia - god help me caveat emptor - here and here.)
This is a plot of percentage of electoral votes vs. the popular vote margin for presidential elections in the past 100 years. Sure enough, the trend shows that the electoral college 'saturates' at somewhere around a 20 percent margin. That is, a 60-40 split in the popular vote will more or less win you a landslide, although there is a fair amount of scatter in the data.
Which is all well and good if you're Reagan in '84 or FDR in '36 (the two largest electoral college landslides on the right end of the trendline), but some of the outliers are pretty interesting too. The two largest popular vote margins (Harding and Coolidge) didn't exactly run away with the electoral college. And for the really close elections (the ones where the winner might want some legitimacy amplification) the effect tends to be pretty small.
And then of course there's poor Al Gore - the only datapoint, in this century, to fall below the x-axis.
[Update: Barack Obama beat John McCain by 6.5% and received 365 electoral votes, which puts him right on the trendline (red dot), and quite close to Bill Clinton's first election.]
This is a plot of percentage of electoral votes vs. the popular vote margin for presidential elections in the past 100 years. Sure enough, the trend shows that the electoral college 'saturates' at somewhere around a 20 percent margin. That is, a 60-40 split in the popular vote will more or less win you a landslide, although there is a fair amount of scatter in the data.Which is all well and good if you're Reagan in '84 or FDR in '36 (the two largest electoral college landslides on the right end of the trendline), but some of the outliers are pretty interesting too. The two largest popular vote margins (Harding and Coolidge) didn't exactly run away with the electoral college. And for the really close elections (the ones where the winner might want some legitimacy amplification) the effect tends to be pretty small.
And then of course there's poor Al Gore - the only datapoint, in this century, to fall below the x-axis.
[Update: Barack Obama beat John McCain by 6.5% and received 365 electoral votes, which puts him right on the trendline (red dot), and quite close to Bill Clinton's first election.]
Sunday, November 25, 2007
Data Blogging: Name Popularity
One website we had quite a bit of fun with while choosing a name for Quinn was the Social Security Administration's historical ranking of the popularity of baby names. Here are the popularities over the past 100 years of some of our names:
Timothy and Laura are clearly baby-boomer names (although neither cracked the top 10), while Jean and Irene are somewhat old-fashioned and have been on the decline for years (the combination Laura Jean didn't crack the top 1000). Quinn, as a name for a girl, is rarer but growing more popular in recent years (Quinn for a boy is more common).
One quibble is that I wish they provided raw numbers of people with each name in addition to rank popularity (since there are considerably more people now than in 1907). Anyway, it's a fun website to play with.
Timothy and Laura are clearly baby-boomer names (although neither cracked the top 10), while Jean and Irene are somewhat old-fashioned and have been on the decline for years (the combination Laura Jean didn't crack the top 1000). Quinn, as a name for a girl, is rarer but growing more popular in recent years (Quinn for a boy is more common).One quibble is that I wish they provided raw numbers of people with each name in addition to rank popularity (since there are considerably more people now than in 1907). Anyway, it's a fun website to play with.
Sunday, August 26, 2007
Sunday Data Blogging (08/26/07) - Employment
While digging around at work looking for something unrelated, I stumbled across this data table (PDF) from the U.S. Small Business Administration (data courtesy of the U.S. Census) and I thought it was pretty fascinating so I thought I would share. It tabulates total employment, payroll and number of firms for businesses of various sizes (more data here). Here's a plot of total employment for different-sized businesses (from 2004, in 23 bins of varying sizes, plotted on a log-scale).
First off: binning data in uneven bins (i.e. comparing 5-9 against 400-499, or whatnot) seriously distorts the distribution and is a no-no. Total employment from the largest firms dominates everything else, which may or may not be the case. I couldn't find the raw data to do it better, but we can at least plot the cumulative distribution of the given data, which solves the binning problem to a certain extent:
This is a much more useful plot. From this we can see that the 5.8 million businesses with less than 100 employees (which I would colloquially define as "small") account for about one-third of the employment in this country. Similarly, businesses with more than 2,500 employees (which I would colloquially define as "gargantuan" and of which there are only 3,500 nationally) are also about one-third of employment. Again, even the cumulative plot isn't perfect in this case; it would be better to break that final >2500 data point down even further to see what the trend really looks like. Still, most of us work for pretty big companies, and only a really small portion of the workforce works in Mom 'n' Pop joints.
For me, the plot raises the question: what is the socially optimal distribution of employment? And what did this plot look like historically? In a lot of ways, smaller is better when it comes to creating healthy communities (or at least that's my bias), so what policies can we implement that might foster more smaller, community-friendly businesses and fewer corporate behemoths?
I don't know, but I thought it was worth thinking about. Yay data!
First off: binning data in uneven bins (i.e. comparing 5-9 against 400-499, or whatnot) seriously distorts the distribution and is a no-no. Total employment from the largest firms dominates everything else, which may or may not be the case. I couldn't find the raw data to do it better, but we can at least plot the cumulative distribution of the given data, which solves the binning problem to a certain extent:
This is a much more useful plot. From this we can see that the 5.8 million businesses with less than 100 employees (which I would colloquially define as "small") account for about one-third of the employment in this country. Similarly, businesses with more than 2,500 employees (which I would colloquially define as "gargantuan" and of which there are only 3,500 nationally) are also about one-third of employment. Again, even the cumulative plot isn't perfect in this case; it would be better to break that final >2500 data point down even further to see what the trend really looks like. Still, most of us work for pretty big companies, and only a really small portion of the workforce works in Mom 'n' Pop joints.For me, the plot raises the question: what is the socially optimal distribution of employment? And what did this plot look like historically? In a lot of ways, smaller is better when it comes to creating healthy communities (or at least that's my bias), so what policies can we implement that might foster more smaller, community-friendly businesses and fewer corporate behemoths?
I don't know, but I thought it was worth thinking about. Yay data!
Friday, October 27, 2006
Birthdays by Month
While we're on the topic of random stuff I've always wondered about... which is the most common month for birthdays? I feel anecdotally that I meet/know a lot of people who, like me, have a November birthday, but maybe I just notice them more? What's the real deal?
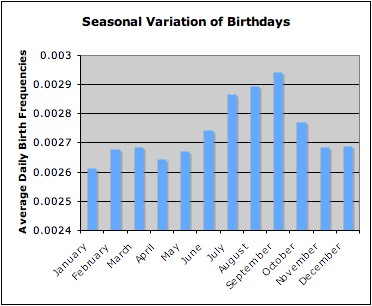
It turns out that the Internet does indeed know the answer to this question (are we surprised?) but it's actually kind of hard to dig up. Every search I tried with any combination of the words 'birthday' and 'probability' automatically gave me a gazillion links to the Birthday "Paradox", which is a pretty interesting statistical oddity in its own right and not entirely unrelated, but also not quite what I was looking for. As these things go, it's always a matter of finding the right google phrase -- in this case "seasonal variation of births" did the trick. In the United States from 1978 to 1987 the distribution of birthdays looked like this:
So September is the most popular birthday month, and January the least. November is actually a bit below average (so much for my subjective impression). Notice that my plot is slightly deceptive in that the y-axis doesn't go down to zero. This means that the 'big' difference between January and September isn't really that big - the variations are only about 5% of the average. It seems, people tend to make babies just about any old time of year.
Perhaps most interestingly, this seasonal variation of births is not the same across cultures and nations. The U. S. peaks in late summer whereas Northern Europe has more spring birthdays. No doubt the variations are very different elsewhere in the world and probably have many interesting implications for the sociologists to untangle.
Subscribe to:
Posts (Atom)